Reading Vibrating Wire Sensors: Spectral Analysis A method to determine the resonant frequency of vibrating wire sensors with improved noise immunity

Reading Vibrating Wire Sensors: Spectral Analysis
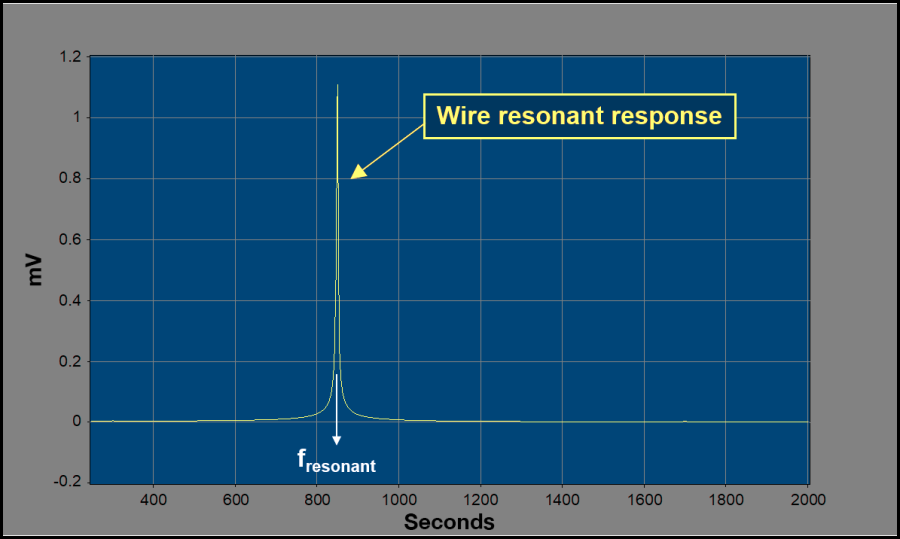
The spectral-analysis approach studies the response of the wire as a function of frequency. Because we are trying to determine the resonant frequency of a tensioned wire, it makes sense to examine the response of that wire as a function of frequency rather than time. The approach applies a Fourier transform to the sampled response to move it from the time domain to the frequency domain, as shown in Fig. 6. By identifying the frequency of the peak response in the resulting spectrum, we have identified the resonant frequency of the wire.
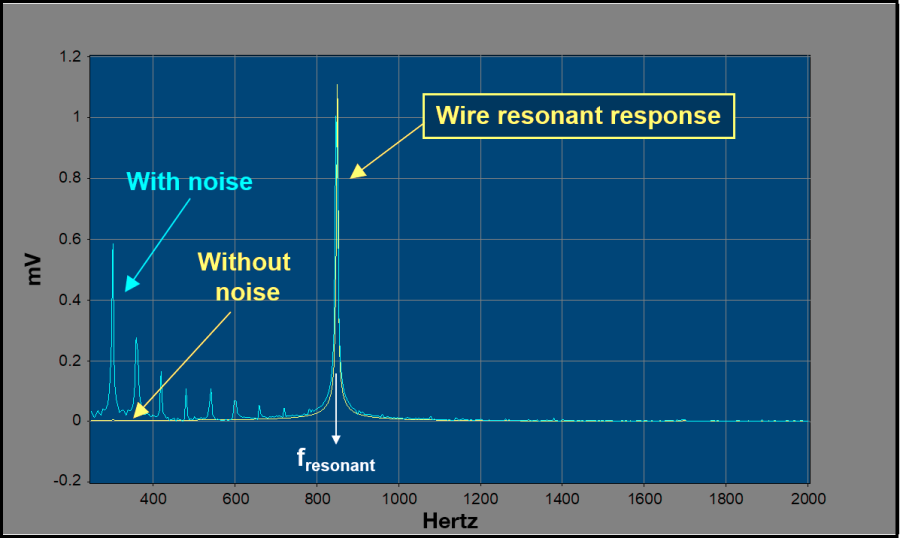
With the data converted to the frequency domain, the sensor's resonant frequency can be determined even in the presence of external noise. As shown in Fig. 7, spectral analysis allows us to distinguish the sensor’s response from the noise.
Spectral analysis also provides improved measurement precision in the absence of external noise, as shown in Fig. 8.
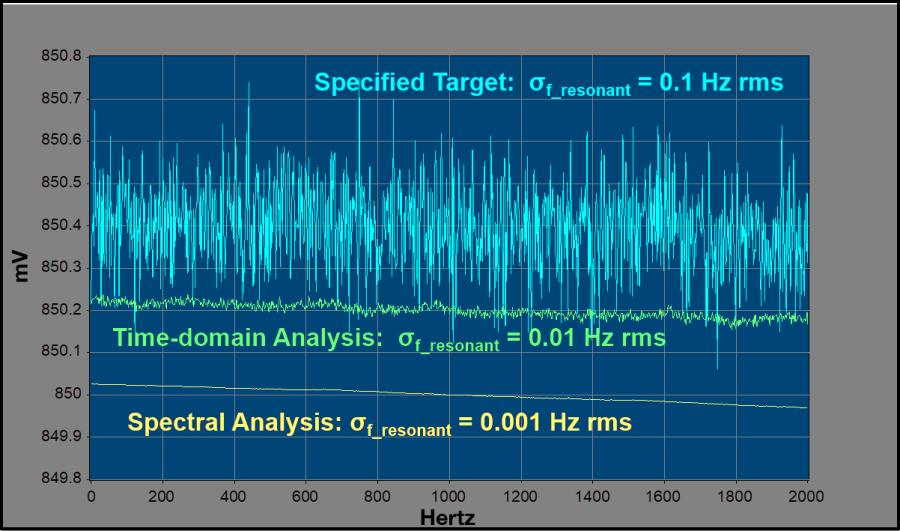
Vibrating wire sensor manufacturers typically want to resolve changes in resonant frequency to 0.1 Hz. Time-domain analysis, in the absence of noise, can achieve measurement precision of 0.01 Hz rms. Spectral analysis achieves measurement precision of 0.001 Hz rms, a significant improvement.
Transforming the sensor's response from the time domain into the frequency domain provides additional advantages—specifically, diagnostics that are not available with the time-domain approach. As shown in Fig. 9, these include signal amplitude, signal-to-noise ratio, and competing noise frequencies.
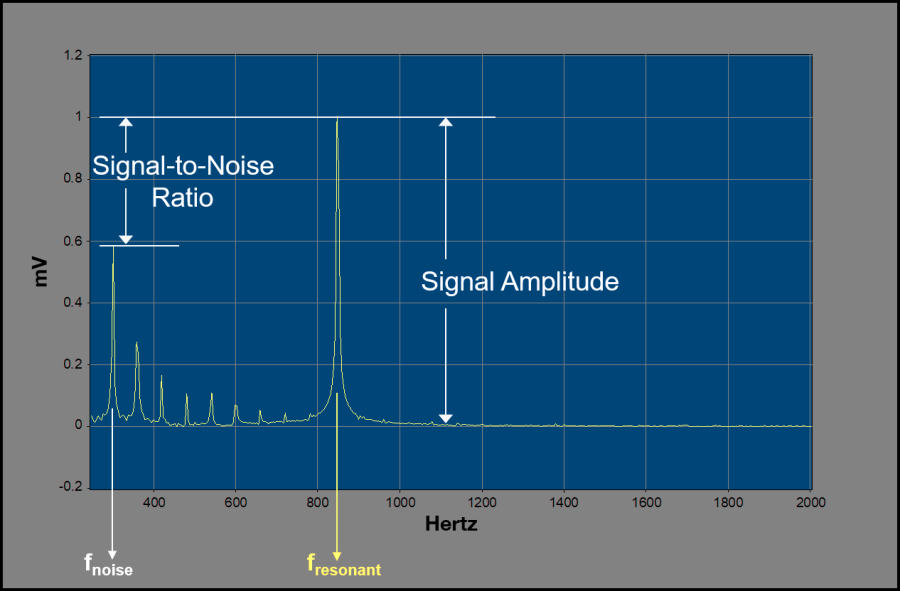
These diagnostics are useful for a variety of purposes, including validating measurements, understanding and identifying noise sources, and determining long-term sensor health. Understanding each of these diagnostics allows a sensor to be used for a much longer period of time, greatly reducing the number of sensors that would be replaced over the life of a project.
While extremely rare, should a vibrating wire sensor relax its internal wire tension over long periods of monitoring (i.e., decades), our VSPECT™ measurement approach will still obtain the peak fundamental sensor frequency, providing decades of accuracy and precision regardless of the vibrating wire amplitude changes.
In summary, the VSPECT approach provides noise immunity, improved measurement resolution and repeatability, the ability to read sensors with very long cable lengths, and useful diagnostics for reading vibrating wire sensors—all significant improvements to those who rely on vibrating wire sensors.